You are using an out of date browser. It may not display this or other websites correctly.
You should upgrade or use an alternative browser.
You should upgrade or use an alternative browser.
Solar Assistant Wish list, Bugs and Issues.
- Thread starter robby
- Start date
Brett V
Mad Scientist
I hesitantly upgraded to the latest 2024-04-05 stable build. The automations might prove to be useful, provided I can figure out how to configure the settings. A little explanation on the SA website on how these thing work would be nice.
In the last build, switching between Grid Bypass and SBU was one touch and done. Now it’s a three step process and as I related in another post, not a deal breaker but still a regression rather than an improvement.
I’ve seen text and email alerts coming soon keeps kicking the can down the road. I’d rather see an actual app with Apple Watch support, and would even pay extra for this convenience.
Despite my minor gripes, SA is still by far the most useful addition to my system.
Brett V
Mad Scientist
Does anyone have a copy of Build 2023-08-16 lurking on their hard drive you could send me? I thought for sure I had saved it on my computer but apparently did not. After many emails with Duane at SA, they refuse to provide a copy and can't understand why I'm dissatisfied with the new stable build.
wattmatters
Solar Wizard
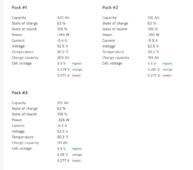
Do the batteries' BMSs themselves report correctly?I noticed that my battery packs always report highest or lowest cell voltage as 3.3. If the average is below 3.3V, then highest cell voltage is being reported as 3.3V and if the average is higher than 3.3V, then lowest cell voltage is reported as 3.3.
I don't see this. My server rack batteries use a PACE BMS.
Data taken from Solar Assistant via MQTT to Home Assistant & InfluxDB/Grafana:
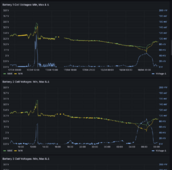
Yes, BMS reports correct data and I can see that if I connect same same RS485 cable to a laptop and use seplos software. I think this might be a bug. Support for V3 BMS was just recently added to the SA beta, so that's very likelyDo the batteries' BMSs themselves report correctly?
I don't see this. My server rack batteries use a PACE BMS.
Data taken from Solar Assistant via MQTT to Home Assistant & InfluxDB/Grafana:
View attachment 209999
wattmatters
Solar Wizard
Sounds like it. Hopefully they can sort out what's going on.Yes, BMS reports correct data and I can see that if I connect same same RS485 cable to a laptop and use seplos software. I think this might be a bug. Support for V3 BMS was just recently added to the SA beta, so that's very likely
doityourself2021
BMS Growatt Man
I just in past three days, received my Solar Assitant Orange PI from Solar Assistant.. preloaded no SD card.. I initially connected via WiFi, however the past 24 hours it has been disconnecting from the WiFi and has available a good WiFi Signal and no issues with the router.. any solutions or best that I run a network cable Ethernet to the Solar Assistant.. ? Thanks in Advance - Ric
I have a T-Mobile home internet router. Two different pi’s wouldn’t stay connected, yet every other device in the house didn’t have a single issue. Ran a Cat8 network cable and it’s been a rock solid connection for a few years. Solar assistant seems faster too.I just in past three days, received my Solar Assitant Orange PI from Solar Assistant.. preloaded no SD card.. I initially connected via WiFi, however the past 24 hours it has been disconnecting from the WiFi and has available a good WiFi Signal and no issues with the router.. any solutions or best that I run a network cable Ethernet to the Solar Assistant.. ? Thanks in Advance - Ric
doityourself2021
BMS Growatt Man
Sounds like I m going to have to get some cable.. , better choice.. sounds like..
meetyg
Solar Addict
- Joined
- Jun 4, 2021
- Messages
- 1,178
Back to the original topic of this thread:
I would like to see what mode the SCC of my inverter is in (bulk/float).
Most Axpert/Voltronic AIOs (and even some clones, like my MUST inverter) have a firmware bug called "premature float bug" (which has been discussed on this forum as well as others).
It would really be useful to see what mode the SCC is in, to understand if we hit float too early (not achieving bulk/absorption phases).
I guess it would be useful/interesting even if your inverter is plagued with this bug.
I have contacted SA with this request (about a month ago) and they said they will consider it, but so far I don't see this feature in the beta version.
Maybe if more users requested it, they will give it priority.
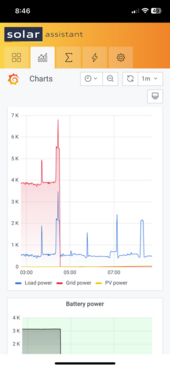
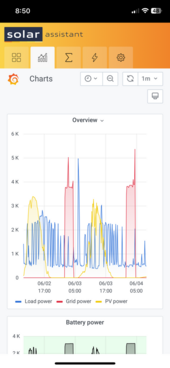
I wish the charting error with peaks shown would get corrected. Note the difference of red (grid) peak with 6hr range it I shows almost 7k watts (true) and when drawn out to 2 days it shows only 5.4k watts (false). It should show at least stick/line I would think. The anomaly only gets worse the longer you draw out the time line and in all the different charts. Or is this just mine, only on a IPhone and not a computer?


wattmatters
Solar Wizard
It's not an error.I wish the charting error with peaks shown would get corrected.
When you chart over longer periods, each data point plotted represents a longer interval, and it is showing the average power value for that interval.
IOW if you want to know actual peaks, you do need to zoom in.
So basically you’re saying that viewing a large interval is useless to look for extremes which is pretty much the only reason I look at them.It's not an error.
When you chart over longer periods, each data point plotted represents a longer interval, and it is showing the average power value for that interval.
IOW if you want to know actual peaks, you do need to zoom in.
Grrrrreat
Last edited:
wattmatters
Solar Wizard
That's the way basic Grafana charting tools operate.So basically you’re saying that viewing a large interval is useless to look for extremes which is pretty much the only reason I look at them.
If you export the data to your own charting tool then you could plot maximums during a given period instead of the mean.
e.g. here is my off-grid inverter's load plotted in Grafana for the last 7 days using the method as shown in Solar Assistant:
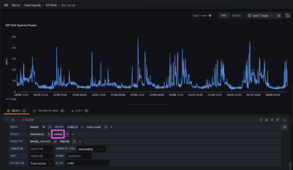
and the same chart in Solar Assistant so you can see how they align and show the same "peaks".
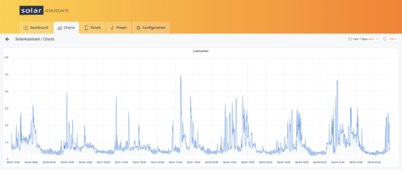
But if I change the plot settings in Grafana to show maximum values by interval, it shows this:
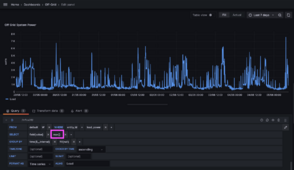
Note the differences in peak values.
This sounds like the sort of chart you want - to work out when peaks occurred.
Similar threads
- Replies
- 4
- Views
- 212


