diy solar

diy solar

Battery SoC% Discharge Question

PR-Solar

New Member
Joined
Oct 5, 2023
Messages
9
Location
MN
1715599387654.png

SYSTEM
I've been running an off-grid system with 24 x 450W panels connected in 3 strings to an EG4 18KPV inverter & storing in a rack of 4 x EG4 48V 100AH LifePower4 batteries in the home we are building in Puerto Rico since January 2024.

We only got internet at the site last week, so I was finally able to install the dongle & upgrade all the firmware (batteries & the inverter both) to the EG4 latest versions.
I've been monitoring (like an addict) this system remotely since our return to Minnesota.

ISSUE
I am curious about the step-wise charge and discharge profiles on the batteries. When the energy stored drops to the teens, it takes forever to charge up to 21% or so, then it jumps step-wise to 35%, followed by another jump to 55% or so, then it goes to full 100% nearly instantly. Same with the discharge - step function.

I anticipated that the charge and discharge plots would be smooth curves, not these giant steps/jumps. It should be a discrete curve, not a step function.
I read here in the forum that the monitor software updates every 5 minutes, but that still doesn't explain the observations.

In PR, we are lucky to have amazing sun power, so the system is fully charged before/right around noon. Throughout the morning, the photon muscle is strong after 7am, and we are pumping 5-7KW or so into the batteries after the house load of a 1KW to 2KW. So with pretty steady wattage charging the batteries, we are getting a stepwise charging behavior, and same with the discharge.

WHY DO I CARE?
I feel like I am missing something fundamental here, and it is important to figure this out because once the batteries drain, we are screwed until the next AM. That happened to me for a week when we only had 2 batteries, and it is not fun. I am trying to gauge the real KWh left in the charged batteries so that I can plan my power consumption after 4PM when the temps drop to reasonable outside. I am making kitchen cabinets with power tools that will suck up stored energy fast. I am talking about a cabinet saw, a planer + a bunch of smaller tools. I want to have enough juice left for the AC's to keep me cool through the night.

Thanks in advance for your thoughts.

 
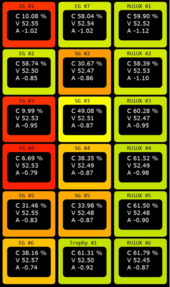
For me, a 48 volt system, with 4 brands of batteries and all SOC values are mostly not usable.
Right now, 0651:

1715601089993.png

Look at the voltages and range of SOC.
 
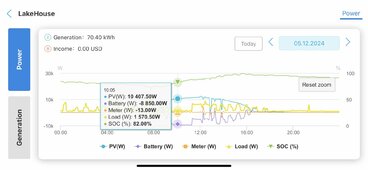
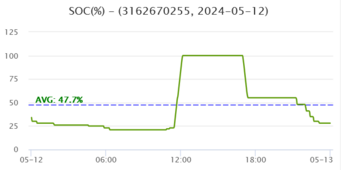
I can't help you with EG4 equipment, but your expectation of what the charge curve should look like is not incorrect. For example, here's what the SOC graph looks like on my GoodWe GW9600A-ES for yesterday. The green line is the SOC. For reference this is a Hybrid DC coupled inverter with 210 kwh of Tesla Model 3/Y modules making up the 400v high voltage battery pack.

Seems like something is seriously wrong with the EG4's SOC tracking.

IMG_2639.jpg
 
What are your charge settings?
Maybe the BMS is cutting out early due to cell overcharge.
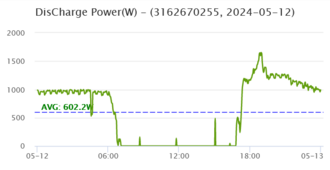
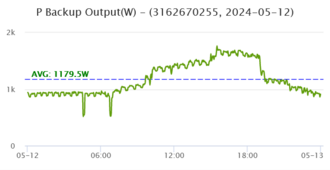
How does the power out look? Getting close to the 400 ah?
 
What are your charge settings?
Maybe the BMS is cutting out early due to cell overcharge.
How does the power out look? Getting close to the 400 ah?
1715603908052.png1715603703492.png

I am not sure how to get the charge settings off the remote EG4 monitor software.
Whatever the default charge settings on the EG4 batteries were, that's what's running.

Thanks
 
If I calculate it right, you are getting about 250 ah, or about 13kWh. Discharging to 25%, that implies 17kWh capacity.

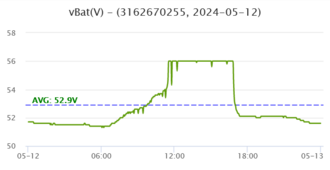
Voltage chart to see if you are fully charging.
 
1715631086646.png
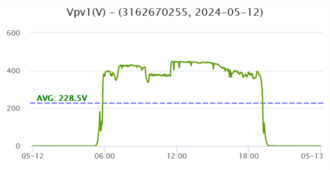
i am not sure if this is the one you want to see or the PV from each string;
they all look similar to this:
1715631194693.png
the string above is 10 panels with 49.5V each, so 495V is the theoretical limit.
i've been seeing 450V at the peak sun times consistently.
 
sorry, no.
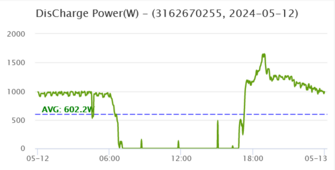
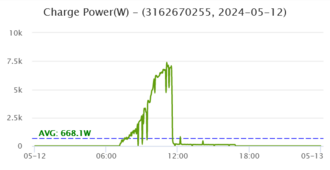
i am going to post battery charge and discharge power graphs; current is just the ratio of those to the battery voltage above:
1715636428125.png1715636464987.png
 
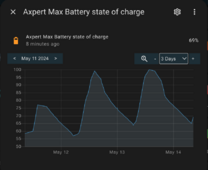
You are right in that battery SOC should not have such large steps. Something isn't right with the battery monitoring or BMS SOC calibration. They can drift and not be completely reliable.

Perhaps consider installing a Victron smart shunt and monitor that instead. This is mine over last few days:

Screen Shot 2024-05-14 at 8.35.31 am.png
 
sorry, no.
i am going to post battery charge and discharge power graphs; current is just the ratio of those to the battery voltage above:
The voltage charts look right. The amp charts may show if a battery is cutting out early, and not fully charging.

If I were you, I would fully charge 1 battery at a time. And then parallel them together.
 
Back
Top