diy solar

diy solar

Strange Victron MPPT Algorithm and Behavior

ricardocello

Watching and Learning
Joined
Apr 4, 2023
Messages
552
Location
Virginia, USA
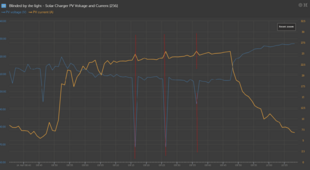
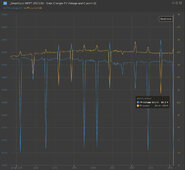
Here is my SmartSolar 250/100 at midday on a beautiful day, PV volts and amps.
We know every 10 minutes it scans for a better power point. Except when it doesn’t.
I can’t tell when it wants to and when it doesn’t.

In any case, why in the world would it take voltage all the way down to 80v?
Obviously the max power point isn’t there. And then other times it tries higher voltage.
Has the algorithm they use been completely reverse engineered here?
Victron isn’t really informative.

Is there any chance the 1 minute sampling if VRM is misleading me, and it is always doing this?
IMG_6636.jpeg
 
Last edited:
Here is my SmartSolar 250/100 at midday on a beautiful day, PV volts and amps.
We know every 10 minutes it scans for a better power point. Except when it doesn’t.
I can’t tell when it wants to and when it doesn’t.

I have observed that it only does it when conditions haven't changed significantly for 10 minutes.

When conditions change, sweeps aren't as evident.

In any case, why in the world would it take voltage all the way down to 80v?

I can't say. It looks like a rule along the lines of, "stop once at 50% of prior MPPT voltage."

I'm assuming they apply some magic derived from a large data set.

Obviously the max power point isn’t there. And then other times it tries higher voltage.
Has the algorithm they use been completely reverse engineered here?
Victron isn’t really informative.

Is there any chance the 1 minute sampling if VRM is misleading me, and it is always doing this?

No, and maybe.

You can get more out of monitoring the MPPT on VC Trends to truly answer the question. IIRC, it can log a data point every couple seconds.

If you enable "show range values" for the VRM chart, they become more evident as it's not just recording the momentary conditions every 60 seconds, but the min/max range over those 60 seconds.

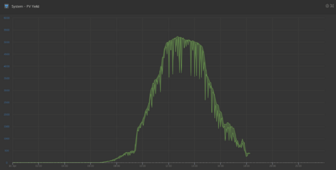
Here's momentary for me:

1713131245939.png

Very little clear skies today. I only notice sweeps when conditions don't change.

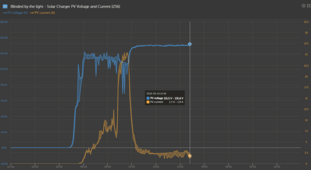
Here's the whole day with range display:

1713131521679.png

Looks like there might be some more in there.
 
I'm assuming they apply some magic derived from a large data set.
It's not that I don't trust their wisdom, I just can't figure it out.
You can get more out of monitoring the MPPT on VC Trends to truly answer the question. IIRC, it can log a data point every couple seconds.
Yes I definitely use the Victron Connect Trends plots, but I didn't have it open today.
If you enable "show range values" for the VRM chart,
It was enabled. But usually you see some shading in the display indicating the range.
So the chart above is the min/max.

Here's momentary for me:
Yes, very similar. Thank you.

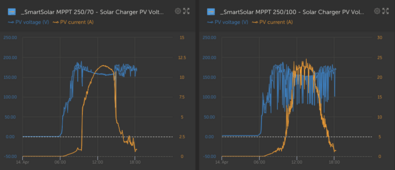
Here is my whole day on the 250/100 (4s2p) and the 250/70 (4s1p).
The 250/70 gets less morning shade, and the 250/100 gets less afternoon shade, thus the leaning power distributions.

Screen Shot 2024-04-14 at 6.17.44 PM.png
 
Last edited:
In an unrelated note, I just now went up and changed the tilt of all of the panels from 45 degrees to 30 degrees.
If tomorrow weather is the similar, I'll plot the difference.

Also, there is green tree pollen on the panels, not visible front on, but on edge easily seen.
I'll clean that off tomorrow and attempt a comparison. For the "clean your panels" thread people.
 
Back
Top