diy solar

diy solar

Solar Insolation Calculations

It's not the equations, but SAM is really good at playing what-if games (e.g., what if I tilt my panels 2 more degrees? What if I change the azimuth 10 degrees? What if I put them all on the west peak? Is this panel with a lower temperature correction better than this cheaper panel with a higher one? How does the Sol-Ark compare to the Skybox for my weather patterns? What's the payback period if they do away with net metering? How much can I really save with a 5 kWh battery to compensate for TOU? How much clipping will my inverter see with these panels?). A pain to get setup and learn, but once you have that you can answer endless questions. Strongly recommend the tutorial videos.... but happy to answer any questions on it.
 
It's not the equations, but SAM is really good at playing what-if games (e.g., what if I tilt my panels 2 more degrees? What if I change the azimuth 10 degrees? What if I put them all on the west peak? Is this panel with a lower temperature correction better than this cheaper panel with a higher one? How does the Sol-Ark compare to the Skybox for my weather patterns? What's the payback period if they do away with net metering? How much can I really save with a 5 kWh battery to compensate for TOU? How much clipping will my inverter see with these panels?). A pain to get setup and learn, but once you have that you can answer endless questions. Strongly recommend the tutorial videos.... but happy to answer any questions on it.
Cool, just downloading it now

I'd still like a way of doing my own insolation calculations via something like a spreadsheet. Most resources are either very focused on grid tied systems (where the big money is) or dont provide enough information (e.g. solar handbook only has major cities)
 
You can get insolation maps of nearly any area on earth by googling something like "insolation map uk", which turned up: https://www.sciencedirect.com/science/article/pii/S0960148114002857

1597705607008.png

...I'd still like a way of doing my own insolation calculations via something like a spreadsheet. Most resources are either very focused on grid tied systems (where the big money is) or dont provide enough information (e.g. solar handbook only has major cities)...
Hmmm... I doubt Excel could handle the math to calculate the "hours per day at the equivalent of full strength solar". The straight-forward part is calculating the amount of solar radiation striking any point on earth and can be calculated with a little calculus to get the area under the w/m^2 per time curve which changes everyday for a given latitude based on the Earth's orbit, axial tilt, and of course precession.

That's the relatively easy part. If that's all there were to it every latitude would have the same insolation; but it changes capriciously with longitude. That's because of elevation, pollution, air-mass, humidity, and other local weather patterns all affect it. I'm not sure how you'd go about getting that... for all I know we might not even be able to calculate it... it might be based on satellite observational data.
 
I can get good insolation data from nasa via an api using lat,long which takes into account weather etc. This is in kWh/m2/day averaged by month. What I'd like to do is model the effects different panel tilts will have in a similar way to this calculator http://www.solarelectricityhandbook.com/solar-irradiance.html (this sites location is very general and there are some huge gaps)
 
I can get good insolation data from nasa via an api using lat,long which takes into account weather etc. This is in kWh/m2/day averaged by month. What I'd like to do is model the effects different panel tilts will have in a similar way to this calculator http://www.solarelectricityhandbook.com/solar-irradiance.html (this sites location is very general and there are some huge gaps)
I can tell you how to get that if you post the NASA URL ;-)

It's simple trig. The irradiance is based on watts per meter squared. To get the full power you need the
maximum amount of the panels surface area collecting that energy, which is perpendicular to the sun.
The more the panel is tilted away the less of it's surface area is getting available w/m^2.

So, in the diagram, the panel is the longest line. Think of the Sun's energy as coming straight down,
so the maximum energy the panel can see is represented by the bottom line. So, at angle C, the
panel only gets 8/10 the max possible.
finding-sine-icon_small.webp
 
The NASA data is available here https://power.larc.nasa.gov/

Info on how to access it starts here https://power.larc.nasa.gov/#dataaccess

API Data is here https://power.larc.nasa.gov/docs/services/api/

I can tell you how to get that if you post the NASA URL ;-)

It's simple trig. The irradiance is based on watts per meter squared. To get the full power you need the
maximum amount of the panels surface area collecting that energy, which is perpendicular to the sun.
The more the panel is tilted away the less of it's surface area is getting available w/m^2.

So, in the diagram, the panel is the longest line. Think of the Sun's energy as coming straight down,
so the maximum energy the panel can see is represented by the bottom line. So, at angle C, the
panel only gets 8/10 the max possible.
finding-sine-icon_small.webp

Ok you are going to need to walk me through it, because I've gone down a rabbit hole and melted my brain with this :/

If I have the following insolation data for Brighton, UK- 50.820916, -0.137434 (50°49'15.3"N 0°08'14.8"W)

JanFebMarAprMayJunJulAugSepOctNovDec
0.881.622.674.195.385.665.584.763.241.91.080.67

How would I calculate the figures with some tilt (t). Lets just keep everything pointing south for now
 
Example
Insolation of 4
1 kW Array perfectly perpendicular: 4 kWh/d

The hypotonuse (panel) x the cos(angle) is the amount of possible energy. So, at 10 degrees, the cos(10) is 98.5%, so only 98.5% of the energy is getting through or 4 x .985 = 3.94 Wh. So, the insolation goes from 4 to 3.94.
 
Last edited:
Example
Insolation of 4
1 kW Array perfectly perpendicular: 4 kWh/d

Perpendicular to what? The insolation is measured on a flat (to the ground) panel so the sun shines on that through the day at a variety of different angles sunrise through the zenith to sunset. At approx 51 deg latitude the sun is never perpendicular to a flat panel. All of these angles vary through out the year (I’ve been using the middle day of each month because it’s averaged by month )
 
Hmmm, did I mention I'm not an expert? It should be fairly close.

In the example above, the 10 degrees is offset from the sun's angle, so if the sun was at 40 degrees it assumes the panels were at 30 or 50 degrees from level.

So, let's use some data from the calculator and see how it does. We'll use Cambridge which has a latitude of 52.2. The Earth's tilt is 23.5 degrees, so in winter the sun is at 52.2+23.5 degrees to summer at 52.2 - 23.5 degrees, or 75 to 28 degrees. From the calculator at 23 degrees insolation is 1.08 for Dec and 4.7 for July. At 53 degrees the insolation is 4.7 for Jul and 1.16 for Jan. At 38 degrees insolation is 1.05 for dec and 4.28 for July.

So, at 23 degrees in winter the tilt is 0 relative to the sun. In Dec at 23 degrees it's perpendicular to the sun, so with out hypotethetical 1kW array: 1.08 x 1 = 1.08, is the maximum possible energy. To convert to 38 degrees, is 38-23=15 degrees. Cosine of 15 is 96.5%. 1.08 x 96.5% = 1.043 ✅ that's pretty close to 1.05.

Let's go the other way. At 53 degrees in July is the maximum energy at 4.7. So, to go to 38 degrees is an offset of of 15 degrees.
4.7 x 96.5% = 4.5 ❌ So that's off... should have been 4.28.

Ah shoot... I know what it is, even posted about it today. There's an "edge effect" that's more predominant in summer than winter that makes the morning/evening angles steeper and would through the calculations off more in summer. That's probably going to be a pain to figure out.

You can see why I use SAM. ;)
 
This is a gov site that combines tilt and location statistics which is better to have then just tilt angle. But I cannot put my finger on it. Rainy seasons are also factored into data. You can also use the location temp stats to predict panel temp rise which helps with predicting Voc and Vmp voltages over the months of year.

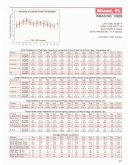
They are WBAN charts. You might Google that. They look like attached example.
Miami FL solar radiation.jpg
 
Let's take another crack at this and see if we can come up with something better.
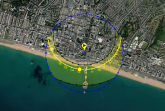
This time we'll even use Brighton... -50.820916, -0.137434, the sun elevation
ranges from 24° to 54°.

The top black line is the sun's path in summer, the yellow today's, and the
bottom black line the sun's path in winter. The top line being more curvy
is the one that messed up the simple calculation and why winter is more accurate.

We'll set the calculator to facing directly south and not vary it in this test.
1597747939441.png

From the calculator we know roughly the insolation at various panel tilts, note tilts are measured from vertical so 90° is flat with the calculator)
Month (sun angle)90° (flat)24°39°54°NASA*
Mar (39°)2.673.143.283.272.7
Jun (24°)5.664.294.895.45.64
Sep (39°)3.243.633.843.873.3
Dec (54°)0.671.221.191.090.68
* Using the NASA API for the All sky insolation incident of a horizontal surface at the same lat/long (should map to 0°).

Easiest thing to do is cheat. From post #11 we know the basic formula, and the sun path represents a quadratic. So we could just add a correction that is solved for a given latitude, probably cos( Δα ) ± (ax^2 +bx + c); where minus for elevations under 39° and plus for under.

The goal is to use the NASA data to calculate the insolation at the other angles as the insolation calculator does. Let's do that first without the correction factor just using the tilt angle.

In March the sun is at an elevation of 39°, so a perpendicular panel would be tiled (90-39)° to get the maximum energy. From the NASA API we know 2.7 = max cos(39); solve for max, and get 3.47; close to the expected value of 3.27. Let's calculate the rest from the NASA data:
NASA insolation 90°Max Perpendicular°24° (actual)39° (actual)54°(actual)
Mar (39°)2.73.473.35 (3.14)3.47 (3.28)3.14 (3.27)
Jun (24°)5.656.185.35 (4.29)5.96 (4.89)6.18 (5.4)
Sep (39°)3.34.254.1 (3.63)4.25 (3.84)4.1 (3.63)
Dec (54°).681.161.16 (1.22)1.12 (1.19)1.0 (1.09)

About what we expected, summer values are too high and winter values too low. So, all that remains is to get a better guestimate is to solve for a, b, and c for a given latitude ;-) Did I mention SAM was easier?
 
Here's a spreadsheet and explanation from the New Mexico State University: https://aces.nmsu.edu/pubs/_circulars/CR674/welcome.html for how it works.

CR674_5.jpg
What the earlier attempt in #11 missed was that Earth isn't flat, since it's a sphere β in the diagram above changes throughout the day.
B O O M ! ! !

You sir are a star!!! this is exactly what I needed and a million times more thank you. I really appriciate your efforts to work this out and then finding this and sharing it

Full of love for the internet right now, places like this really are the best of whats possible, I see people freely sharing information that really helps. No agenda just the instinct that by helping someone else with something it creates a place where someone will help if and when you need it and the opportunity to learn. Supercool

Thanks again
 
Example
Insolation of 4
1 kW Array perfectly perpendicular: 4 kWh/d

The hypotonuse (panel) x the cos(angle) is the amount of possible energy. So, at 10 degrees, the cos(10) is 98.5%, so only 98.5% of the energy is getting through or 4 x .985 = 3.94 Wh. So, the insolation goes from 4 to 3.94.
In god we trust, all others bring data!
 
Wouldn't this tool just be good enough for what you're trying to do:
https://re.jrc.ec.europa.eu/pvg_tools/en/tools.html
Yes and no

I'm actually looking at developing a simple series of tools that could help people along their journey that often leads them here. Combining simple power auditing to size batteries then using insolation data to help size panel arrays all aimed at off grid use

Just checking it, its data base is missing some locations, mine for instance Auckland
 
OK

Been looking at the NMSU spreadsheet calculator and comparing it with the Solar Handbook caculator

From Google MapsLatLong
52.486012, -1.89252452.486012
1.892524​
Birmingham UK
JanuaryFebruaryMarchAprilMayJuneJulyAugustSeptemberOctoberNovemberDecember
Flat Panel1.152.293.965.987.478.127.786.524.642.771.400.89
Tilted Panel2.964.516.077.307.868.007.877.396.364.823.202.46
1-Axis Tracker4.066.208.319.9410.5910.6210.449.778.436.444.323.37
2-Axis Tracker4.306.328.3110.1311.3011.7211.3710.158.456.484.513.62
solarelectricityhandbook
Birmingham UK Flat0.711.352.283.474.514.694.694.042.71.650.90.57
Difference0.440.941.682.512.963.433.092.481.941.120.500.32
%38%41%42%42%40%42%40%38%42%41%36%36%

Conclusion - In this case for a flat panel the NMSU calculator is reading about 40% over. This would make sense for UK weather. With very limited data it follows that it should be easy enough to use the difference in the results from the calculator and insolation data to look at different panel angles. I need to do a range of testing to do that though. Its a pretty laborious process, a macro or 2 should ease things along
 
Can you use the NASA API to get the flat insolation with weather and then use the tilt calculations from the spreadsheet to adjust it?
The NASA data also had a "clear sky" index, possibly that's a factor you can just multiply by to get the average data with weather?
 
Back
Top