diy solar

diy solar

Solaredge production data and graphs and history

koutroul

New Member
Joined
Jan 1, 2024
Messages
22
Location
Cyprus
Hello is there any way go get the following information from a Solaredge SE10K/optimisers?

1. Daily Graph per panel or group of panels (e.g. create 3 groups of East West North and add panels to ecah group)
2. Historical data are keeping just a Weekly/Monthly/Yearly/Total values per panel or I can see more details per panel? Can I see what each panel produced on a day that passed? Can i see the different readings (not sure if its 5 min or 10 min or 15 min intetvals) for a day in the past?
3. Are this kept in a database and how to connect to it to produce my own reports?
4. Is there any out of the shelf reporting software that I can use to do reporting?
 
Did you research what Home Assistant / Grafana provides? That is the goto thing I would research if I was interested in this.

I’m 90% certain there is a connector from SolarEdge to that system
 
Did you research what Home Assistant / Grafana provides? That is the goto thing I would research if I was interested in this.

I’m 90% certain there is a connector from SolarEdge to that system
can i do it with my account or need ans admin account ? or should i connect to the RS485 interface on the inverter physically to get data? do I need any special device?
 
can i do it with my account or need ans admin account ? or should i connect to the RS485 interface on the inverter physically to get data? do I need any special device?
I haven't used it nor do I own a SolarEdge inverter. There are a lot of ways people have done this, hopefully at least one of them work for you, and the level of interest means eventually you can find someone that can help you set this up.
 
AFAIK, the inverter will push all data up to SolarEdge periodically, which provides a web-based dashboard, where you can view the info. In a normal customer view, you can see total system production daily, weekly, monthly, yearly. From the layout page, you can do a playback to see production of the panels over time (e.g. at 15-20 min intervals for a day or across a week).

If your installer has given you some admin access, there will be an analyze page, where you can get per panel report on current, energy, module voltage, optimizer voltage, and power. Looks like it can show for day, week, month, or custom period and can select all or a set of panels.

You may also have the Report tab, which would give you info on A/C energy, site status, site commissioning, and module mismatch (for a day).

Lastly, SolarEdge has an API to their monitoring site. You installer can give you an API token (or if you have some level of admin access you can create one), and then you can write a program that queries the API to get all sorts of information on your site. Granted, you are limited to like 300 API calls a day, and you need to be able to write a program to access the API (yeah you can access via a browser or via a command line tool, like "curl"). Here is the API document - https://developers.solaredge.com/docs/monitoring/e9nwvc91l1jf5-getting-started-with-monitoring-api

I don't know how long SolarEdge keeps the data, and any data is gone, if you change out your inverter, so I've write a Python app to collect the data I wanted so that I can generate reports (mostly on total production, consumption, self consumption, import, export, inverter status/state). With that, I've been able to track performance over time and even calculate ROI.
 
can thw data on the inverter (before they arrive to SolarEdge) or even after they are on SolarEdge Data Center be modified? Is the inverter database and Solar Edge database Read Only both for installer and me (i am not admin)? Can data be manipulated by the installer? They installed panels at a side shaded by taller buildings and inititially shaded side was 20% down and now this shaded side produces even more than the not shaded.
From the API that SolarEdge provides, it is read only, so I don't think there would be any modification going on. The communication from the inverter and SolarEdge is proprietary (I would love to be able to get the raw data off the inverter, rather than have to poll their API - but don't the desired to spend the time sniffing packets from the inverter to try to figure it all out).

If you have some admin abilities, you can see the panel(s) performance through the day, as I mentioned (you may want to ask for that access, from your installer). Ideally, the installer should be able to look at this info to see if there is anything going on.

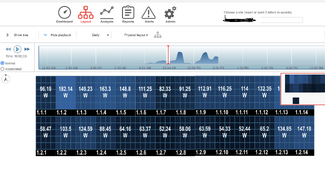
Even with the normally available Layout page on the website, you can use the playback to see the power generated on each panel at any instance of time for the current day, current week,or current month (note: you can't go back to some arbitrary date and then show the playback). You should be able to see shading effect and production at any point in time. For example, here is my system at 10am today:

Layout.png
I've got (tree) shading across the bottom row, and it was very cloudy today, so several panels were obstructed throughout the day. The red line in the playback window lets you slide left and right and see the production at different times.

Do your panels shaded by the building, maybe have a better angle when they are producing, versus the ones that are not shaded?
Is it possible that it was cloudy during various times of the day, affecting the performance of the unshaded panels?

With this layout page, you can see the wattage of each panel at about 15 min intervals. Pick a sunny day and at the end of the day check the panels on each orientation at the different times to see if the peak production and shaded production make sense.
 
From the API that SolarEdge provides, it is read only, so I don't think there would be any modification going on. The communication from the inverter and SolarEdge is proprietary (I would love to be able to get the raw data off the inverter, rather than have to poll their API - but don't the desired to spend the time sniffing packets from the inverter to try to figure it all out).

If you have some admin abilities, you can see the panel(s) performance through the day, as I mentioned (you may want to ask for that access, from your installer). Ideally, the installer should be able to look at this info to see if there is anything going on.

Even with the normally available Layout page on the website, you can use the playback to see the power generated on each panel at any instance of time for the current day, current week,or current month (note: you can't go back to some arbitrary date and then show the playback). You should be able to see shading effect and production at any point in time. For example, here is my system at 10am today:

View attachment 188113
I've got (tree) shading across the bottom row, and it was very cloudy today, so several panels were obstructed throughout the day. The red line in the playback window lets you slide left and right and see the production at different times.

Do your panels shaded by the building, maybe have a better angle when they are producing, versus the ones that are not shaded?
Is it possible that it was cloudy during various times of the day, affecting the performance of the unshaded panels?

With this layout page, you can see the wattage of each panel at about 15 min intervals. Pick a sunny day and at the end of the day check the panels on each orientation at the different times to see if the peak production and shaded production make sense.
some panel are shaded from next buildings and I can see the shade of the buildings in those panels. I complained to the installer but avoided any responsibility. I dont have admin access. when internet is off and then on again the inverter graphs are paused sometimes for 6-7 minuites some times for even 12 hours or more. So although Internet connection is coming back up sometimes take hours to see graphs or data of a single day's production. So for some reason connection from Solaredge server is manually frozen and when Intermet connection of the inverter is restored data are not being synced to the server.
I cant see a reason of the data not being synced within 10-15 mins max from the time Internet connection is restored. Also I cant understand how not East (side with not shaded panels or taller neighbouring buildings) was producing 20% more than west and now west panels producing more. Total production now of a West is bigger than an East panel. This pausing of syncing at Server side happens every single day. So if the Internet is droped you see data being paused and then synced at the end of the day (which dont see it normal).
What I suspect is that data upload is paused then data modified and at the end of day they are allowed to be uploaded to the server.
 
I’m not sure what this complexity of cooking the books is going to help them. So I am skeptical of that theory. Maybe if they got turnkey software to do it.

You can call them on busted numbers if you add your own power meter on the AC connection of the inverter (if grid tie system). If there is a battery you will need access to the shunt or other charging data.

You can look into getting local access (tons of threads out there) over serial bus, you will likely need cooperation from installer to get the config ability to turn it on. Otherwise you will be stuck. That is probably the highest value thing you can do with your time right now, getting local access.

The main thing the panel level data will tell you is if some panels are busted or the strings weren’t attached correctly.
This company did some mess so I am the stage of trying to estimate how big it is. E.g. Drilled through the roof tiles and mount some rails on these bolts that are just loose seating on the tiles. sooner or later my rood will start leaking or even worst panels can fly away. Then kept asking me money above of what we agreed and when i showed them proofs of payments they just said sorry. So then i noticed the shading and when i asked them why they said there was nothing done wrong.

So to put an in line power meter or to get readings from the RS485 interface or through web admin (i dont have admin access) in all cases i need to go through them?

Can in line power meter get readings from all 30 Solaredge S400 optimizers and be also passthrough to the inverter in a seamless way?

what i expected is that there some sort of local db or a file where data are stored temporarily on the inverter and they may found way to freeze the upload and alter them before unfreezing the upload.

only way i can make sense in court is prooving its doable and then to ask independed monitoring from an external while they will have no access.
 
Can in line power meter get readings from all 30 Solaredge S400 optimizers and be also passthrough to the inverter in a seamless way?
No it only gets the total. Why would you need their permission for online meter? You just need to install energy meter in consumer unit and put CT clamps around AC circuit for solar

To get the panel level data you need to get access credentials to something on the SolarEdge side.

SolarEdge system is used to manage shading so the main question there is whether they messed up the layout and put panels in a dumb place where they could have instead put it somewhere without shading. If you signed and approved the layout before they started there’s not much you can get with fighting them IMO. Maybe install new rails elsewhere to move the panels to.

what i expected is that there some sort of local db or a file where data are stored temporarily on the inverter and they may found way to freeze the upload and alter them before unfreezing the upload.
There’s no way for random installer to have the capacity to develop this. They would have to buy it from a vendor.

Also I don’t really see what they would gain from messing with the panel level data. Any tampering with the total output is super easy to detect with a simple AC meter and very stupid to do.
 
I really doubt the "manipulation of data theory". If internet connection is lost, the inverter will store the data, and upload, when connection resumes. Who knows why there is a delay in reporting. If you are having issues with the data resuming, why not open a case with Solar Edge? They tech support is very slow and sometimes hard to get a knowledgeable person, but if you are persistent, you should get some help.

If you use the Layout tab, and playback the production for the day. How does the power output of the panels that are shaded throughout the day look, compared to the ones that are not shaded? The screen shows the output of each panel at 15 minute increments. Is there anything usual? Maybe a problem with an optimizer or panel or wiring or whatever?

The installer should easily be able to look at the panels for a day to see what is going on. Maybe try (nicely) to ask for enough admin to see the additional data (I don't have full admin, but I do have enough to see the Analyze and Report tabs). Then you can look at it easier to see what is going on (though that should be the installers job - you should only have to report that there is a problem).

You can also raise your concerns to SolarEdge, and they can do that same remote monitoring and tell you if there is any issue seen. If there are, they will likely want your installer to get involved, but at least you;ll have evidence of a problem.

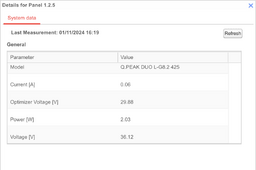
Also, on the Layout page, you can right click and show info to see the info for a specific panel:

Screenshot 2024-01-11 at 6.19.22 PM.png

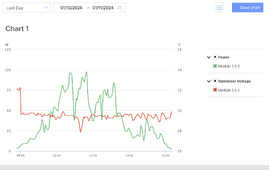
Here is some Analysis output for a panel:
Screenshot 2024-01-11 at 6.20.47 PM.png

You can also view current, module voltage, and energy.
 
No it only gets the total. Why would you need their permission for online meter? You just need to install energy meter in consumer unit and put CT clamps around AC circuit for solar

To get the panel level data you need to get access credentials to something on the SolarEdge side.

SolarEdge system is used to manage shading so the main question there is whether they messed up the layout and put panels in a dumb place where they could have instead put it somewhere without shading. If you signed and approved the layout before they started there’s not much you can get with fighting them IMO. Maybe install new rails elsewhere to move the panels to.


There’s no way for random installer to have the capacity to develop this. They would have to buy it from a vendor.

Also I don’t really see what they would gain from messing with the panel level data. Any tampering with the total output is super easy to detect with a simple AC meter and very stupid to do.
i didnt sign any plan before they installed anything. they brought their experts, did their studies and decided where to install the panels and later I noticed that they were shaded and they said it is ok. So like anyone would do I sarted 'digging' to see if everything was done properly.

The daily total will not make any sesne to modify. What makes sense to modify is the daily production of shaded or all west panels. If they trasnfer part of production of east to the west they can have 'proofs' that they did everything right and that they correctly installed the panels in the west and despite they are shaded they produce more than the east.

By altering production data they can fix one of their mistakes and show that shaded panels and rest of west panels produce more than east. Before I comment the shading east were producing 20% more than west and now west is producing much more than east panels.

Observing daily total of all panels will not help. i need to see the real daily production of each panel/optimizer seperatly.

I cant understand how production of east and west changed so dramatically after i commented to them about the shading and why upload from inverter to the solaredge server takes sometimes minuites and sometimes even hours after Inteenet connection of the inverrter is restorted. I expexted that always once you restore Internet connection within 10-15 mins the daily data will be uploaded to solaredge server and not sometimes 5 mins ans some times after several hours.
 
Well, we're going to have to agree to disagree.

You need to get that panel level access. The only thing that can get it is in the SolarEdge ecosystem.

You can use the European version of PVwatts (can't remember what it's called) to estimate the maximum production level on the other part of the roof based on angle and number of panels.

Good luck, I don't think there's much more I can add here and it's unclear if I've actually helped here or in your previous threads ?
 
I really think your looking in the wrong place, trying to determine if there was (malicious) manipulation by the installer. They just don't have that kind of access to change information from the system.

I think a better effort is to try to understand what the panels are producing, and whether that makes sense. Maybe there is a hardware failure somewhere, or a configuration issues (my understanding is that the optimizers have to pair with the inverter).

I mentioned how you can see each individual panel power output in 15 min intervals with the basic user access, as a simple measurement.

You can also contact SolarEdge to have them look at the performance (voltages, power, current, etc). They have full access to the site. You can ask them to confirm your suspicions on production from the various strings, and whether or not they see any issues (panels, optimizers).

Learn as much as you can, by looking at the monitoring site, and try to get the installer to give you more access to you site. I had to get access from the installer, as SolarEdge would not give me access - they told me I had to go through installer. The more you know, the better the conversations you can have with SolarEdge.

Hopefully it is not to late, but try not to burn bridges with the installer. Be polite and tell them you'd like to better understand the performance of the system, as it is complex, and that you'd like to have more access to the monitor web site (e.g. to access analyze/report screen) so that you can better understand how the panels are performing.

If the relationship hasn't turned negative already, tell them it's hard to tell, but seems like the performance looks different between the strings and that you are hoping they can take a look to see if that is the case (and mention that is why you'd like access to the analyze/report screens so you can better understand how the strings are working throughout the day.

Lastly, why are you having internet connectivity issues? One would hope that you have consistent, reliable internet access, so that the reporting will not be interrupted from the device to SolarEdge. If there is a problem there, you may want to focus on squaring that out. Otherwise, SolarEdge will not have a full picture of the system performance over time (they can still check the current performance).

I'd work on all three fronts - installer, SolarEdge, and self data collection...

I don't have any other ideas that that...
 
Back
Top