You are using an out of date browser. It may not display this or other websites correctly.
You should upgrade or use an alternative browser.
You should upgrade or use an alternative browser.
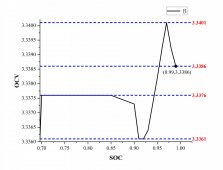
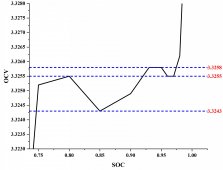
The SOC-OCV curve of LFP battery is non monotonic
- Thread starter Leon_Xp
- Start date
robby
Photon Vampire
- Joined
- May 1, 2021
- Messages
- 4,142
What are you measuring this with and what parameters are you charging the cell with and what time period is this measurement done over? Room temperature changes alone could account for this.
Your not even close to 99% SOC which would be about 3.61V but more importantly the curve is behaving in a non monotonic way over a 1.5mv Range. Are you using a meter that has the kind of precision and accuracy?
Then comes the question of did you repeat this test on multiple cells or just one?
Your not even close to 99% SOC which would be about 3.61V but more importantly the curve is behaving in a non monotonic way over a 1.5mv Range. Are you using a meter that has the kind of precision and accuracy?
Then comes the question of did you repeat this test on multiple cells or just one?
Last edited:
I charged and discharged the cells three times using a current of 20 A for capacity calibration. Then, the charge amount for each SOC interval was determined based on the calibrated capacity.This ensures that my SOC values are accurate. In addition, the interval is set to 1% for SOC within 90%-99% with a rest time of 1h, and 5% for SOC less than 90% with a rest time of 2h. The current used for the whole process is 0.2C.I can confirm that my SOC values are correct.The error of the measurement device is about 0.1mV, so the effect of measurement error can be omitted.What are you measuring this with and what parameters are you charging the cell with.
Your not even close to 99% SOC which would be about 3.61V but more importantly the curve is behaving in a non monotonic way over a 1.5mv Range. Are you using a meter that has the kind of precision and accuracy?
Then comes the question of did you repeat this test on multiple cells or just one?
Regarding the last question, I did the same process for multiple cells from the same batch from this manufacturer. They all had inconsistent SOC-OCV curves, but all showed non-monotonicity at the stage where the SOC was at 70%-99%, with some cells having more severe non-monotonicity.
I did not draw the point where SOC = 100% in either schematic. This is because the larger OCV at SCO=100% would make the non-monotonic presentation of the curve in the figure less obvious.

Bud Martin
Solar Wizard
- Joined
- Aug 27, 2020
- Messages
- 4,844
"The error of the measurement device is about 0.1mV"
0.1mV at what Voltage scale?
Test equipment usually gives the percentage error spec.
Can you please provide the make and model of this test equipment?
0.1mV at what Voltage scale?
Test equipment usually gives the percentage error spec.
Can you please provide the make and model of this test equipment?
Any chance these cells are interconnected with nickel-strips and tack-welds?
Long ago I saw something similar when a batch of cylindricals were tack-welded with an underpowered welder, and you could practically pull the strips off with a fingernail. Under charge or load, they looked very similar to this.
Long ago I saw something similar when a batch of cylindricals were tack-welded with an underpowered welder, and you could practically pull the strips off with a fingernail. Under charge or load, they looked very similar to this.
No it's not a cell issue. It can be:When I tested OCV on a 100Ah LFP cell, I found that its SOC-OCV curve was non monotonic at 70% - 99% SOC. Is this a problem of cell production process?
-Bad (intermittent) welds causing problems during charge and/or monitoring
-Error in measurement. You claim accuracy to .1mv and you are seeing jumps of .15mv. Slightly more error than you expect will give you that.
Ampster
Renewable Energy Hobbyist
So what is the implication on someone like myself who has a 42 kWh stationary pack which gives me a hedge against increasing energy costs? I also drive two EVs which have a combined capacity of 150 kWhs. In the past ten years I have probably driven 200,000 miles in EVs. Why would I care about any of this?
No real implication. He's just reporting on something he saw that is likely setup or measurement related.So what is the implication on someone like myself who has a 42 kWh stationary pack which gives me a hedge against increasing energy costs? I also drive two EVs which have a combined capacity of 150 kWhs. In the past ten years I have probably driven 200,000 miles in EVs. Why would I care about any of this?
Ampster
Renewable Energy Hobbyist
Thanks for the explanation, I won;t change my settings on my staitionary pack or my EVs then,No real implication. He's just reporting on something he saw that is likely setup or measurement related.
Carry on.
robby
Photon Vampire
- Joined
- May 1, 2021
- Messages
- 4,142
Yes, I suspect it's a little blip on the full scale. The reasons behind it would probably be something that a Chemist could answer better than an EE. It's definitely not significant enough to worry about but it is interesting.---SNIP---
I did not draw the point where SOC = 100% in either schematic. This is because the larger OCV at SCO=100% would make the non-monotonic presentation of the curve in the figure less obvious.View attachment 115900
Last edited:
Since the sensor is installed inside the charging and discharging equipment, I do not know the model number of the sensor. However, I used a multimeter to compare the voltage measured at the positive and negative terminals of the battery with the measurement results of the charging and discharging equipment, and I can believe the degree of error of the charging and discharging machine."The error of the measurement device is about 0.1mV"
0.1mV at what Voltage scale?
Test equipment usually gives the percentage error spec.
Can you please provide the make and model of this test equipment?
This is a square-case battery type cell (32mm*136mm*269.2mm), and both positive and negative posts are made of copper nickel-plated material. The power cord of the charger and discharger is connected to the poles using O-type terminals and nuts to complete the fastening.Any chance these cells are interconnected with nickel-strips and tack-welds?
Long ago I saw something similar when a batch of cylindricals were tack-welded with an underpowered welder, and you could practically pull the strips off with a fingernail. Under charge or load, they looked very similar to this.
But the data file sent to me by the manufacturer of the battery shows that the SOC-OCV curve they provided also appears similar to my own test results. Normally, the test environment and test results provided by the manufacturer are credible, right? So I wondered if this was due to this manufacturer's process, which caused this situation.No it's not a cell issue. It can be:
-Bad (intermittent) welds causing problems during charge and/or monitoring
-Error in measurement. You claim accuracy to .1mv and you are seeing jumps of .15mv. Slightly more error than you expect will give you that.
This doesn't make sense to you, you can choose not to click into this thread or choose not to reply. I just wanted to show a phenomenon that is strange and has bothered me.So what is the implication on someone like myself who has a 42 kWh stationary pack which gives me a hedge against increasing energy costs? I also drive two EVs which have a combined capacity of 150 kWhs. In the past ten years I have probably driven 200,000 miles in EVs. Why would I care about any of this?
Yes, I also think that this situation may be caused by the complex electrochemical reactions inside the battery. However, I cannot use the open circuit voltage method to determine the initial SOC value when the battery is in this voltage band. Even if there is no error in the voltage measurement, the non-monotonic condition of the SOC-OCV curve makes the BMS alarm when the initial SOC is read by the table look-up method.Yes, I suspect it's a little blip on the full scale. The reasons behind it would probably be something that a Chemist could answer better than an EE. It's definitely not significant enough to worry about but it is interesting.
Ampster
Renewable Energy Hobbyist
I did choose to reply because I was interested if there is any practical application. Thanks for clarifying.This doesn't make sense to you, you can choose not to click into this thread or choose not to reply.
This relationship is part of the reason active balancing is often a waste of time.
It is a well known phenomenon with LiFePO4, and differs depending upon the charge rate.
In most cases it is insignificant, but if you are using voltage setpoints to determine SOC with LiFePO4 you are going to be disappointed in many instances.
It is a well known phenomenon with LiFePO4, and differs depending upon the charge rate.
In most cases it is insignificant, but if you are using voltage setpoints to determine SOC with LiFePO4 you are going to be disappointed in many instances.
Interesting - is your application one of testing a monotonic Echo State Network to help determine the SOH (state of health) in a vehicular LiFePO4 application?
I'm not that smart - you had me searching for this and running into paywalls, but did find some info about it. Just wondering.
I'm not that smart - you had me searching for this and running into paywalls, but did find some info about it. Just wondering.
wattmatters
Solar Wizard
It may assist others to explain why these findings bother you. It's a DIY forum full of people eager to learn and absorb new information.This doesn't make sense to you, you can choose not to click into this thread or choose not to reply. I just wanted to show a phenomenon that is strange and has bothered me.
Ampster
Renewable Energy Hobbyist
Can you elaborate? I found 1Amp active balancing effective on my 42 kWh pack compared to the 200 mAmps my traditional shunt based BMS was able to do.This relationship is part of the reason active balancing is often a waste of time.
Similar threads
- Replies
- 4
- Views
- 522
- Replies
- 3
- Views
- 290
- Replies
- 258
- Views
- 13K
- Replies
- 3
- Views
- 234
- Replies
- 6
- Views
- 280


