diy solar

diy solar

Current difference on rack batteries

cmack

New Member
Joined
Aug 2, 2022
Messages
101
Location
Ontario, Canada
I have 6x Jakiper 48v 100Ah in a server rack. Originally 1 set of 2/0 wires in a diagonal configuration on the bus bars. Now 2 sets of 2/0 wires in a square configuration.

In both cases, I have considerably less charge / discharge current on the top and bottom batteries.

Batteries all connected to the bus bars with identical length 2AWG wires. Inverter to bus bar cables are identical length as well (10ft).

Right now, grid charging at ~6.5 KW, the current for each battery, from top to bottom: 12, 25, 24, 21, 20, 10

I recently discharged all batteries to 10% and have cycled them for a few days since. I have, at the odd time, seen higher current on top/bottom. After a typical day of usage, the top/bottom batteries have about 20% higher SOC (50% in the middle, 70% on the top/bottom)

Any ideas why this happens and how to optimize?
 
A couple of things right off the top.
1) TEMPS: Batteries at different temps will have a different charge & discharge rate, the cooler they are, the lower & slower they will be. Even 1 degree Celsius makes a difference. Closest to the floor will be cooler of course. Optimal Performace is at 25C, do not charge them below 0C
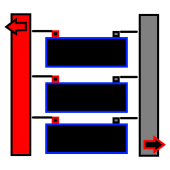
2) Wires: The wires to/from Inverter should be offset, put the (+) at the top of the busbar and the (-) at the bottom of the busbar... This is assuming the bars are running Vertical (portrait) in the rack.
1670413077633.png
 
Things that effect current distribution balance:

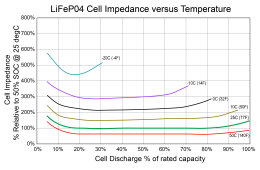
- Temperature, particularly cooler temp effects cell kinetic overpotential voltage (effectively impedance of cell), Increases at greater rate below +15 degs C. If lower rack is cooler, it may receive a lower percent of overall charging current.
Rs vs Temp and SOC for LiFePO4 cell.png

- Cabling resistance variation from charging source, including variations in connectors and BMS's series resistance.

- Cell matching and aging of cells. An older, more used rack will likely receive a lower percentage of overall charging current. Cell kinetic impedance can increase 2-3x over its useful lifetime.

- An abuse event, overcharging, over discharging, excessive load or charge current.

You likely will not get better than about 10-15% variations, but the variations you are reporting (25 to 10 amps) is too excessive and will result in some of the batteries taking more of the work resulting in faster aging on those packs.

First thing you can do is check voltage at battery terminals under the charging current. If voltages match then issue is within battery. It could be temperature variance, so that would be next item to check. Beyond that it is internal connections or cell matching of battery pack.

For a 100 AH cell at 25 degsC, I would typically expect about 70 mV per cell overpotential voltage bump from rested OCV for 10 amp charge current and about 110 mV per cell bump for 25 amps of charge current. Times 16 series cells, that is 1.1v net bump up for 10 amps and 1.8v for 25 amps.

That could be explained having pack receiving 10 amps charge current being at about 15 degsC (59 degsF) while pack receiving 25 amps charge current being at about 25 degs C (77 degsF).
 
A couple of things right off the top.
1) TEMPS: Batteries at different temps will have a different charge & discharge rate, the cooler they are, the lower & slower they will be. Even 1 degree Celsius makes a difference. Closest to the floor will be cooler of course. Optimal Performace is at 25C, do not charge them below 0C
2) Wires: The wires to/from Inverter should be offset, put the (+) at the top of the busbar and the (-) at the bottom of the busbar... This is assuming the bars are running Vertical (portrait) in the rack.
View attachment 123469
1) Here are the readings from the top 2 batteries (1st, 2nd)

Voltage: 53.04, 53.00
Current: -1.18, -2.52
Cell Temps: 19.7, 19.8
PCB Temp: 21.7, 21.2
Env Temp: 22.5, 22.2

2) Wiring was originally diagonal config (exactly as illustrated in your image) and is now in a square config (see attached). I am using 2 sets of wires so my SolArk inverter can use its full potential (275A limit with 2 sets, 160A with 1 set). I experienced the same current differences with both wiring configurations.
 

Attachments

  • square.png
    square.png
    12.2 KB · Views: 4
First thing you can do is check voltage at battery terminals under the charging current. If voltages match then issue is within battery. It could be temperature variance, so that would be next item to check. Beyond that it is internal connections or cell matching of battery pack.
Are you suggesting i take my own voltage readings and compare against the voltages reported by BMS? Or is the info I posted above enough?
 
1) Here are the readings from the top 2 batteries (1st, 2nd)

Current: -1.18, -2.52
If that is battery current you are doing test at too low of current. Your bms or shunt measurement will not be accurate enough to accurately represent that little of current difference. There is also little cell overpotential voltage at that low current.

You need battery voltage, directly on rack pack terminals, current in the full charge 10-25 amp range, and temperature reading for each pack.

You can also do test with moderate load current from inverter AC output loading. In this case the battery will have a voltage slump due to current instead of rise from charging current.

Best to have an alternate instrument to measure things to verify results. Don't trust battery pack BMS calibration for voltage, current, and temps.
 
Last edited:
Best to have an alternate instrument to measure things to verify results. Don't trust battery pack BMS calibration for voltage, current, and temps.
My multimeter has a 10A limit so I guess I need some other device? Any suggestions?
 
My multimeter has a 10A limit so I guess I need some other device? Any suggestions?
You should have a total inverter current separate battery monitor and not rely solely on BMS monitoring.

Clip-on DC amp meter can be used but typically not better than 1% of scale maximum level accuracy. Probably good enough for your needs. Having a clip-on DC amp meter is a must have piece of test equipment for battery operated inverters. A meter with a 40A scale and 400A scale is only going to give you +/-0.4 amp accuracy on 40 amp scale. I have two clamp-on meters. One has 2A and 100A scale (uni-T 210E), one has 40A and 400A scale.
 
Last edited:
Over the last hour or 2 the top/bottom batteries now have the highest current in the rack. Does the BMS have control over how much each battery will charge / discharge based on the load? Or is it all up to physics? Any guess why the top and bottom seem to always have a very similar current?

Edited readings (6 batteries, top to bottom)
Voltage: 52.6, 52.54, 52.54, 52.56, 52.52, 52.55
Current: -6.87, -2.33, -2.4, unknown, -3.2, -6.44

Looking at clamp meters, this one seems decent for the price?
 
Last edited:
I have a self built rack with 6 Jakipers also. But I built it with buss bars on each side. I have all equal length 2 g cables from batteries to buss bars. Then equal length 4/0 to 2 small distribution bars. From there equal 2/0 goes to each of my 6548's.

Even with all of that I see 2-5% difference on the top and bottom batteries. It depends on how much is going in or out. On a normal night it is lower. But with AC running and higher loads it gets closer to 5%. Middle batteries stay pretty close to each other.
 
Are you jumping from battery to battery or is there buss bars?
 
Last edited:
Are you jumping from battery to battery or is there buss bars?
Yep bus bars, my wiring config is described above ^^

I find it interesting that from 100% SOC, the top / bottom have lower current, but later around 80% SOC, they have higher current. Voltages are so similar so I would guess the BMS is involved in this but I really don't know what I'm talking about :unsure:
 
If it would not be too much work, you might try moving your top and bottom batteries to the middle and middle two, too the top and bottom. Then try your test again in a few days. This will confirm the position difference and rule out bms arguments.
I plan to do this to my system every year or two, even though my batteries tend to be in the 10% difference zone.
 
Yep bus bars, my wiring config is described above ^^

I find it interesting that from 100% SOC, the top / bottom have lower current, but later around 80% SOC, they have higher current. Voltages are so similar so I would guess the BMS is involved in this but I really don't know what I'm talking about :unsure:
Yeah something is going on. At 100% mine are all withing .04. As they are used too and bottom will get less. I checked when I got home last night and I was at 80% and almost 2% lower then the next. I will check when I get back what there at. I'm only charging at 20 amps total for 6 batteries right now
 
My system is in constant use, so checking battery difference is a difficult task. That is, to be accurate... I would need to disconnect them from each other, allow them to settle for a bit, then checking voltages. As for charge/discharge current they don't vary much.
 
My system has been running my house since beginning of July. I actually just connect the grid to it last week. We had a week of rain. Never used it. Found out that the inverters use 1.3 kwh just being hooked up to grid. Turned that off this morning.

I use around 10-15 kwh a month because my garage 240v plug is still grid. I don't want my inverters starting my lathe and mill or my welders. I have to pay $10 if I use nothing so what's another $2.
 
CAUTION !
An A-Typical BMS is not necessarily accurate on SOC for a minimum of 2 Full Cycles, sometimes even 3 or 4 full cycles. Some are actually quite craptastic in that regard and an external coulomb counting shunt is required for anything resembling accurate. I do not know what BMS's that Jakiper uses or if there is an Phone App or PC App that let's you monitor & adjust settings.

IF you have an app (PC or Phone) the SOC is derived from the cell voltages combined and the total voltage at the BMS' (+)&(-) terminal connections while some more advanced BMS' also measure the IR Value to determine level of saturation at the set voltage.

Depending on BMS again, the LVD & HVD Disconnect values can be used for the capacity calculations where they see LVD Value as 0% and HVD Value as 100% which is also not correct for the chemistry.

Something to be aware of but that have been twisted up over the past couple of years.
LFP has TWO Voltage Ranges !
The Allowable Voltage Range (like all batteries) that does not cause harm/damage and is safe for use is from 2.500V-3.650V per cell.
The "Working Voltage Range" is the actual working voltage which provides your AH Rating value, this is from 3.000V to 3.400V per cell ! With Nominal Voltage being 3.200V, this means that the the REAL 0% is 3.000, 25%=3.100, 50%=3.200, 75%=3.300 and 3.400=100%.
wives tale believers are now offended... tough keep it to yourselves.

Yes you can charge cells to 3.500 or even 3.600 without harming them but once you stop charge input the cells begin to settle and will always settle around 3.400V per cell. The up curve from 3.4-3.65 is very short & steep and only represents roughly 5-7% of "Gross Voltage" while from 2.950 down to 2.500 is a Cliff Drop and seriously steep as well representing another 5-7% of Gross Voltage. BTW THAT is supposed to be that Mythical 10% from Bottom & 10% from TOP that many MISINTERPRET ! ALL "Grade-A" Fully Qualified cells have a Higher Gross Capacity than the rated capacity, ie a 280AH Cell will test out between 290-295AH When tested from 2.500-3.650 but will deliver 280AH from 3.000-3.400. Bulk or Grade-B cells are NOT Qualified cells and have not passed qualification testing or have some form of visible flaw/damage as well. These typically will come in below the AH Rating of the cells which may only be 1AH or 10AH even.

I just looked over the Jakiper Site and their BMS' seem to have available apps and appear to be reasonably advanced in general. I believe the battery packs themselves should be fairly accurate internally, from the information I could glean. With the APP you should be able to see the Pack Internal Temps allowing you to compare them at the temps and how much they are taking for charge & discharge.

Hope it helps, Good Luck
 
With the APP you should be able to see the Pack Internal Temps allowing you to compare them at the temps and how much they are taking for charge & discharge.
I really should get the app going on my PC. I plan to get all of this data integrated into a home assistant interface, just a matter of finding the time.

Thanks for looking into this and sharing your findings!
 
Back
Top