diy solar

diy solar

Soliscloud app not showing full consumption

ProDiddy

New Member
Joined
Mar 28, 2023
Messages
3
Location
Crewe
I have a 12 panel system with a Solis Hybrid Inverter and i'm having problems with the data that i'm seeing through Soliscloud.
The system was initially installed in October 2022 and through to December the consumption and 'imported from grid' data appeared to be accurate and roughly tied in with what i was seeing in terms of meter readings.
At some point though, the figures started to be way lower than they should be - or at least what i think they should be.

As an example - here are my figures for March

1680014368756.png

The Consumption of 730.36 and 489.51 are way lower than they should be and way lower than my meter readings for the same period.

My meter has moved by approx 850 kWh in the same period and i also have the myenergi app which shows 850kWh imported. I believe the 850kWh figure to be more realistic than the 489.51 but it is higher than i would expect and i'm concerned i#m not getting the full (or any) benefit from the panels. Without accurate data from soliscloud i'm finding it difficult to track though.

I haven't reported this to Solis/Ginlong yet (not sure if i even can)

Has anyone seen anything similar to this before?
 
Welcome! We have a Solis and batteries, but don't use the Solis cloud systems at all, so the following thoughts are just that... thoughts...

a) Can you 'zoom' in on more detail to an hour by hour basis and see whether the data you are viewing from China reflects what you expect for the weather you had that day - e.g. can you look at real time data to see if the panels are producing what you expect?

b) Is some of the "import" being used to charge the batteries (e.g. at night).... if not, it is odd that you got more "energy from the battery" than "Energy to Battery"! If those figures are correct, I want some of those magic batteries ;)

c) I wonder if the "Energy Imported" figure of ~490hWh in the graph takes into account the "Energy Exported" figure of ~43 kWh? i.e. it is showing a net import. Seems odd, but could explain some of the difference to your regular meter. i.e. 489+43 was imported and 43 exported. That would come to 532 which is much nearer to your 550kWh figure. It could also explain why you didn't notice the issue until now as, presumably between November and February you weren't exporting much. [Edited to add, oops, ignore this one... read 850 as 550! - sorry]

Just a thought.
 
Thank you for taking the time to read and reply?

My thoughts (on your thoughts?)

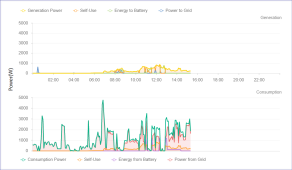
a) The data available is very limited on the app and web page. There are daily views and these include hourly graphs that look like this - there's no option to see data rather than a graph ?
1680017081053.png

I keep an eye on this most days and i'm confident that the generation figures are accurate and reflect what has happened that day in terms of sunlight. My issue is more with the consumption and imported figures which at some point in January suddenly started to significantly under represent what is actually happening.

b) That's a really good spot and i think another figure that is potentially incorrect. I have in the past allowed the batteries to charge from the grid at some point but i stopped doing that a while ago (before March) as i'm on a flat rate tarriff so ultimately there isn't much point in me doing that.

c) I'm expecting to see my energy imported figure up to somewhere nearer 850Kwh not 550kWh so at the moment its some 360kWh short which is miles away and i don't think can be explained using the 43kWh export figure.

Cheers
 
I keep an eye on this most days and i'm confident that the generation figures are accurate and reflect what has happened that day in terms of sunlight
That's good.

My issue is more with the consumption and imported figures which at some point in January suddenly started to significantly under represent what is actually happening... I'm expecting to see my energy imported figure up to somewhere nearer 850Kwh...

So to clarify, in March, you are expecting an import of around 850kWh as well as the ~140kWh generated by Solar (coming either direct or via batteries) - i.e. to give a total house usage of around 990kWh?
 
That's good.


So to clarify, in March, you are expecting an import of around 850kWh as well as the ~140kWh generated by Solar (coming either direct or via batteries) - i.e. to give a total house usage of around 990kWh?
it’s probably more like 135 + 85 + 850 = 1090 (self use + battery charging + meter usage) and 1090 sounds slightly high to me but is probably a lot more accurate than the 730 figure shown in my first screenshot.

Ultimately if my consumption is 1090 and my imported is 850 then that’s fine but I’m wanting the figures showing on solis to correctly reflect that. 730 and 490 are miles away from 1090 and 850 and that’s the issue I’m having ?
 
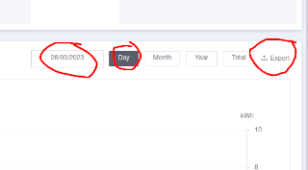
I find the web page is better at reflecting reality than the app. You also get the option to export all the daily data (there is a lot of it) as a .xls spreadsheet from the webpage under the Inverter Details.
Screenshot from 2023-03-28 21-01-27.png
 
Back
Top